Grafana
Grafana allows you to query, visualize and alert on metrics your Zammad installation stores within the Elasticsearch indexes.
Note
🚧 Limitations 🚧
Please note that this guide expects all requirements to be up and running. We will not cover core configurations of each tool. Please also note that we can’t support you with configuration of your specific third party tool.
🤓 Specific use cases
You may have specific use cases which we can’t cover in this documentation. The following sub pages and also our List of Indexed Attributes should provide enough information to help you!
Overview
- Quickly jump to…
- You will need
A Grafana 10.3+ instance (hosted or self hosted)
(read) access to your Elasticsearch index
Warning
Never expose Elasticsearch to the public if you’re not sure how to do it. Especially never without authentication! Zammad stores very sensitive information within the Elasticsearch Index.
a Zammad instance (version 4 or above) that supports your use case
Setting up required data sources
Hint
🤓 You may not need all data sources
Before we start: The data sources always follow the same scheme. We reduced
below information to name, time field name and index name.
Everything else relies on your environment and is out of our scope.
Note
Please replace
zammad_production_with your fitting prefix.
- ES - Chat Sessions:
- Index name:
zammad_production_chat_sessionTime field name:created_at - ES - CTI Log:
- Index name:
zammad_production_cti_logTime field name:start_at - ES - Ticket Articles:
- Index name:
zammad_production_ticketTime field name:article.created_at - ES - Tickets by closed_at:
- Index name:
zammad_production_ticketTime field name:close_at - ES - Tickets by created_at:
- Index name:
zammad_production_ticketTime field name:created_at - ES - Tickets by first_response_at:
- Index name:
zammad_production_ticketTime field name:first_response_at
With above data sources you basically have everything you need to start building your own dashboards. 🎉
Tip
🤓 Not sure about your index names?
Querying your Elasticsearch like this and replace
localhost:9200with the IP/URL of your setup:$ curl http://localhost:9200/_aliases?pretty=trueThis will return a list that looks similar to the following:
{
  "zammad_production_knowledge_base_translation" : {
    "aliases" : { }
  },
  "zammad_production_ticket_priority" : {
    "aliases" : { }
  },
  "zammad_production_stats_store" : {
    "aliases" : { }
  },
  "zammad_production_organization" : {
    "aliases" : { }
  },
  "zammad_production_cti_log" : {
    "aliases" : { }
  },
  "zammad_production_group" : {
    "aliases" : { }
  },
  "zammad_production_knowledge_base_answer_translation" : {
    "aliases" : { }
  },
  "zammad_production_ticket" : {
    "aliases" : { }
  },
  "zammad_production_ticket_state" : {
    "aliases" : { }
  },
  "zammad_production_chat_session" : {
    "aliases" : { }
  },
  "zammad_production_user" : {
    "aliases" : { }
  },
  "zammad_production_knowledge_base_category_translation" : {
    "aliases" : { }
  }
}
The Dashboards
If you want to get inspired, you can also use our sample dashboards as mentioned below. These dashboards can also be found on GitHub.
Importing an existing Dashboard
Navigate to ➕ → Import and either upload the json file you received or use the grafana.com ID. During importing you can provide a dashboard name and folder. You’ll also be asked to map the data sources to your environment. If you used our data source names above, you can simply search for the same name.
Importing existing dashboards by ID
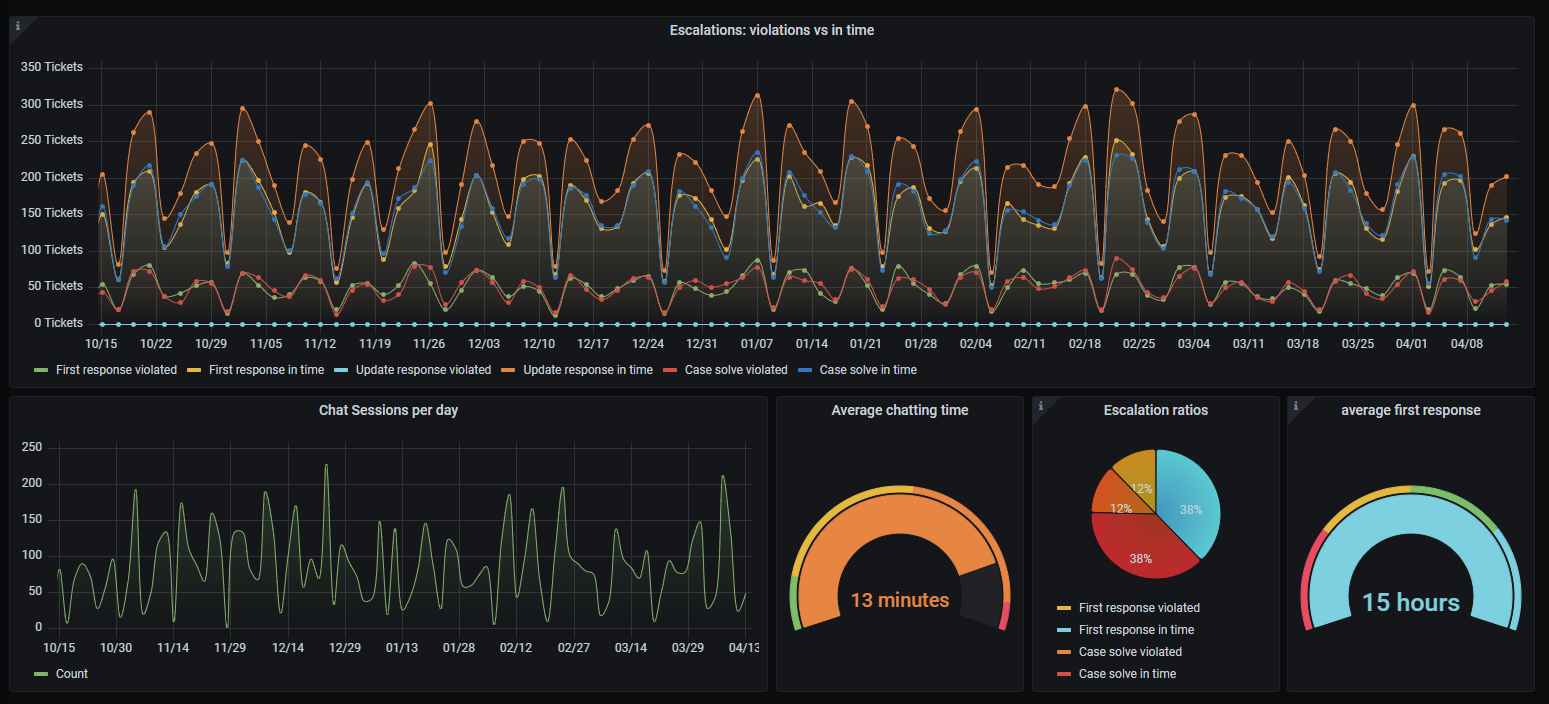
Ticket statistics
Tip
🤓 Grafana.com ID:
14222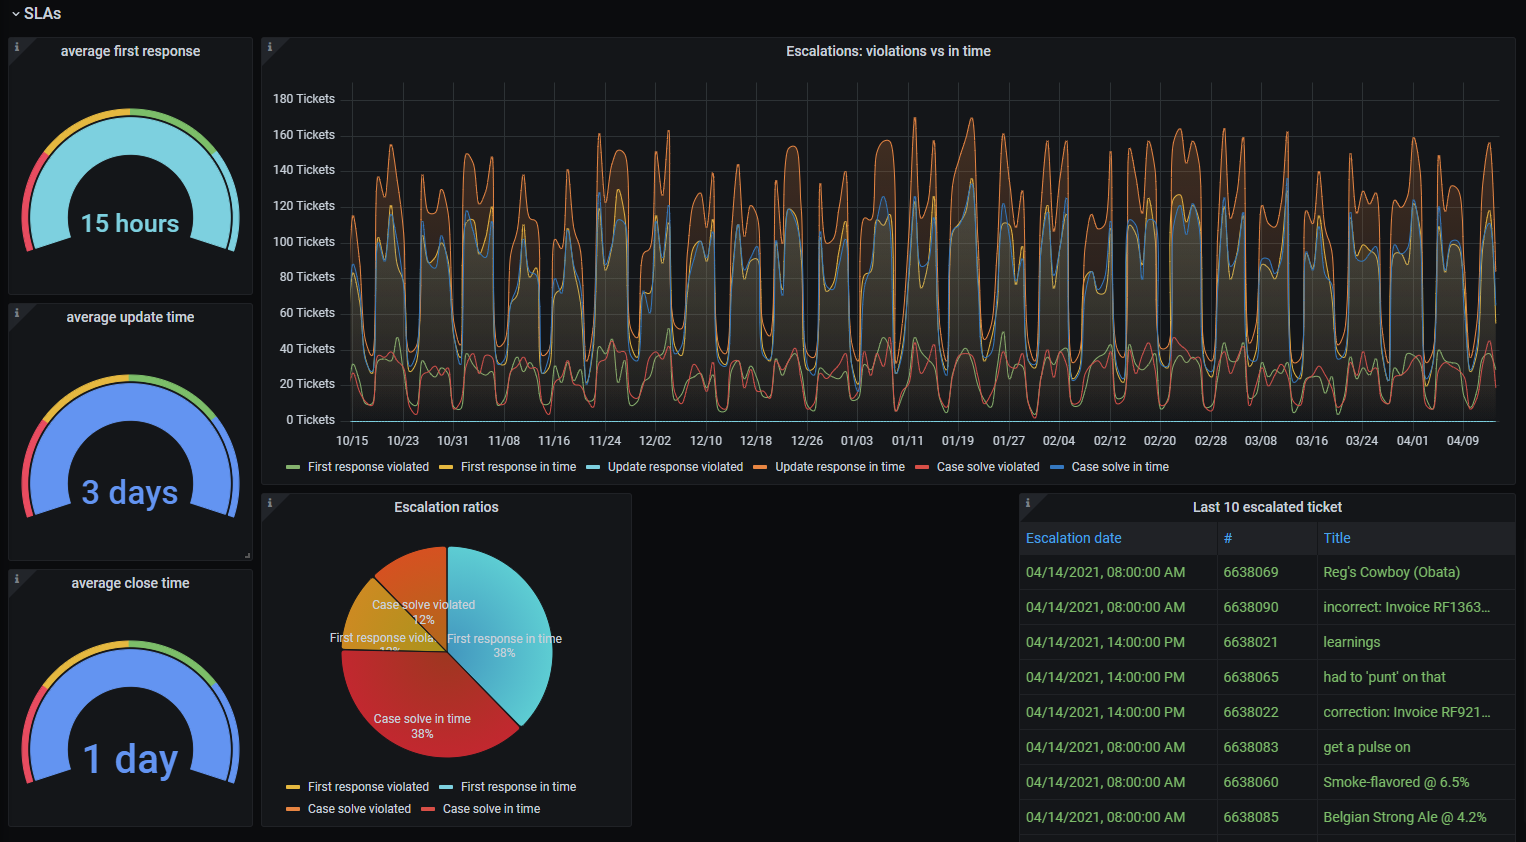
- This dashboard provides graphs for:
- It also contains specific ticket and article meta information:
ticket group distribution
sender ratio (e.g. Customer / Agent) 1
article type ratio (e.g. email, phone) 1
article content type
escalation ratios 2
average first response, update time and close time 3
organization of ticket customer 2
ticket customers 2
ticket owners 2
average accounted time on ticket
ticket tags 2
last 10 escalated tickets
- Required data sources:
ES - Ticket ArticlesES - Tickets by created_atES - Tickets by closed_at
- 1(1,2)
Specific reference IDs are not the same on every instance and thus the panel may not work or show incorrect data. Check the panels description on how to find our the relations on your system.
- 2(1,2,3,4,5,6,7)
Some values are not available as time series information. This means we can only display the last value of the field in question.
- 3(1,2)
Requires SLA function to be active. Negative values indicate SLA violations.
Chat-Session statistics
Tip
🤓 Grafana.com ID:
14224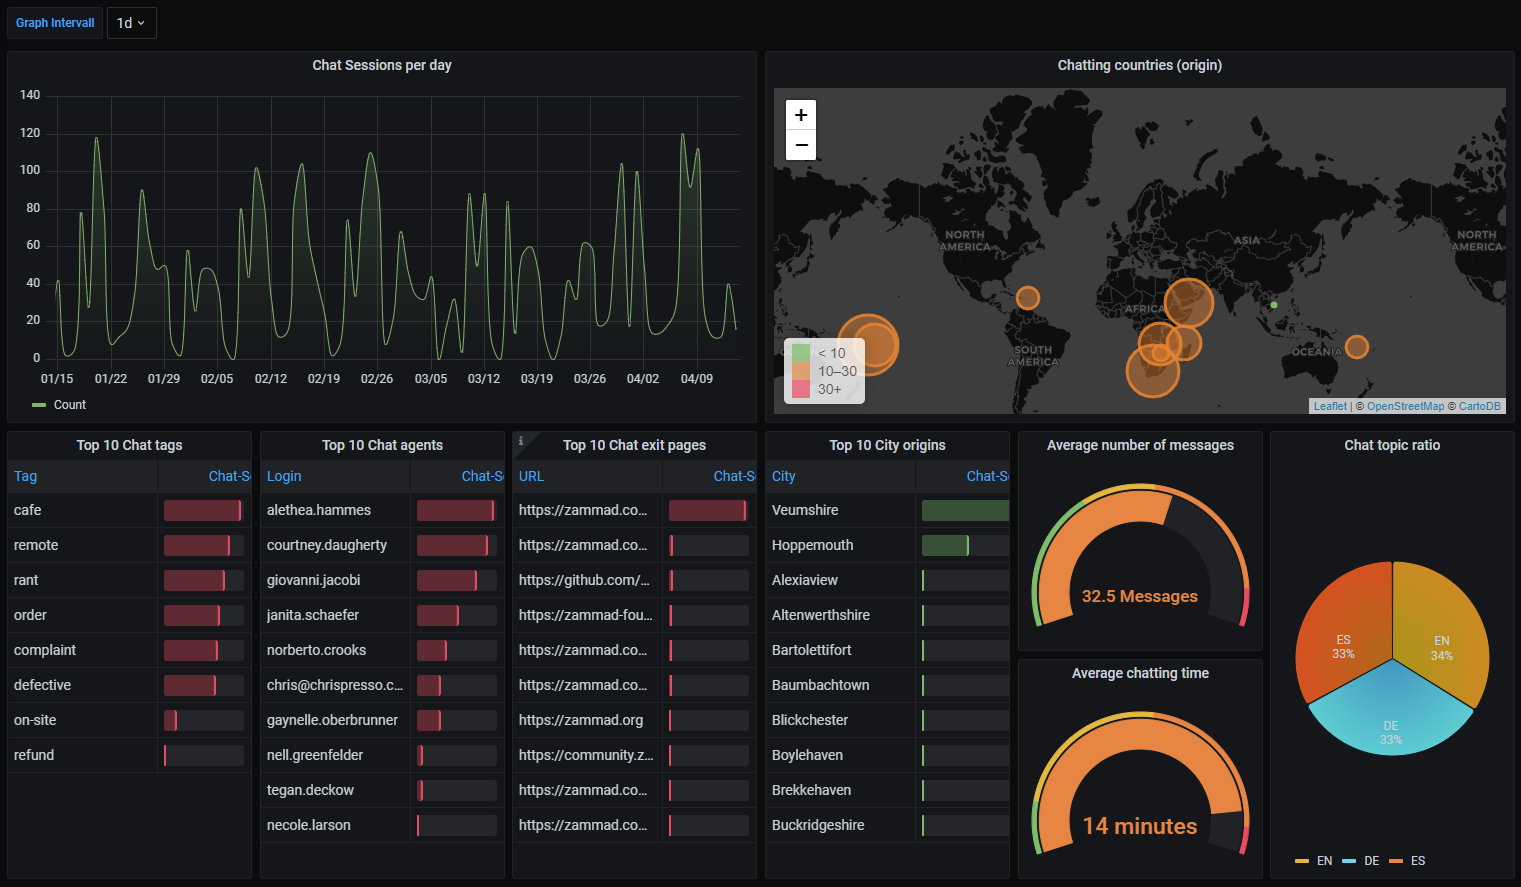
- This dashboard provides graphs for:
Chat session creations
- It also contains specific chat session meta information:
chat tags
chat agents
chat exit pages
city origins
chat topic ratio
average number of messages within chat-sessions
average chatting time
World map with chat origin countries
- Required data sources:
ES - Chat Sessions
CTI-Log statistics
Tip
🤓 Grafana.com ID:
14223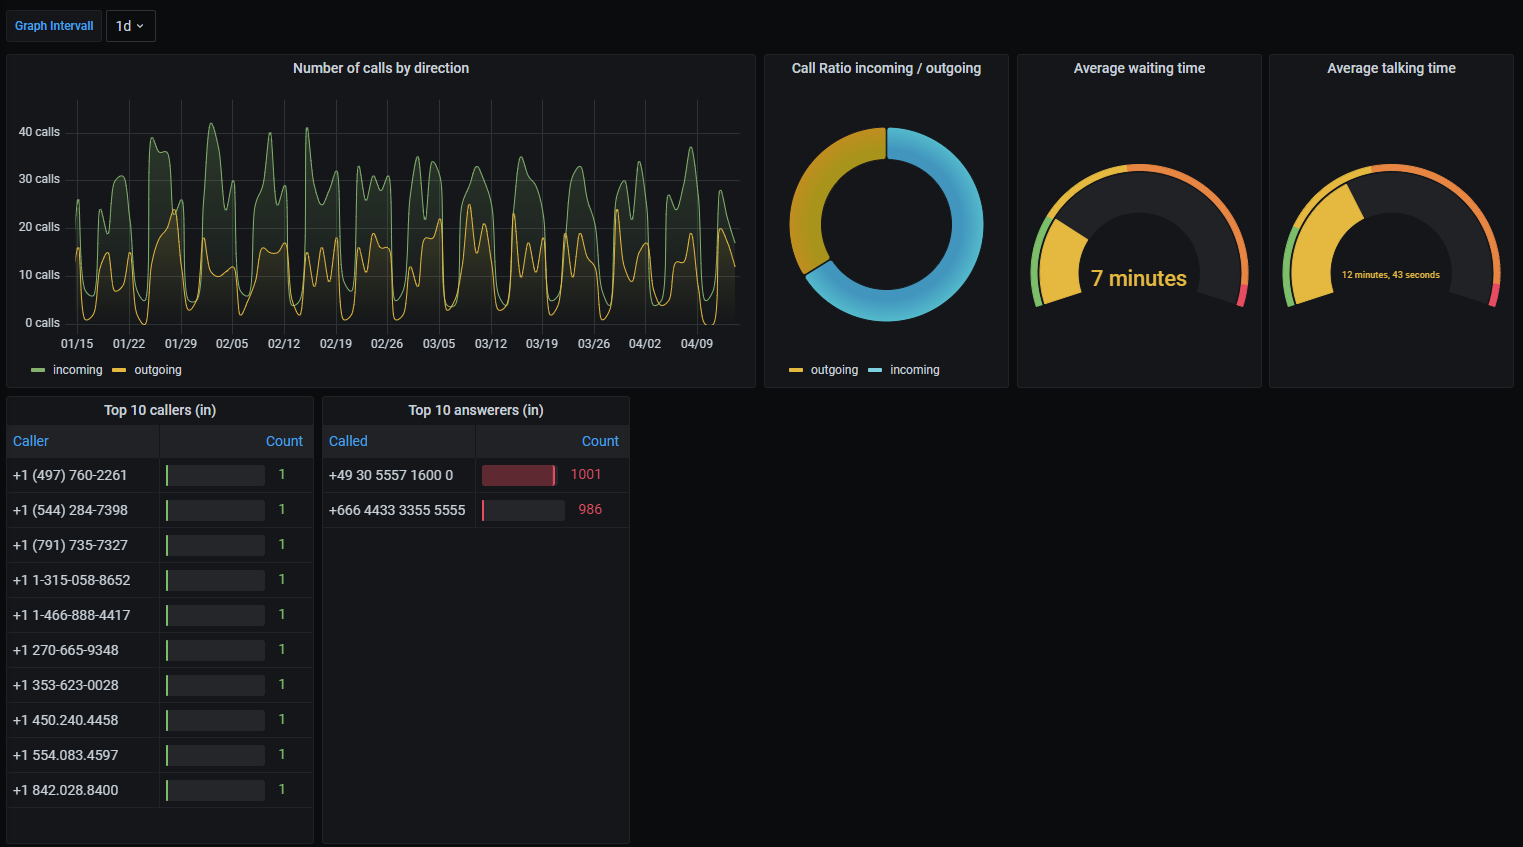
- This dashboard provides graphs for:
number of calls per direction (in / out)
- It also contains specific chat session meta information:
call ratio (in / out)
average waiting time
average talking time
callers (in)
call answerers (in)
- Required data sources:
ES - CTI Log